Round Rock, Texas, has transformed from a modest agricultural settlement into one of the most dynamic suburban cities in Central Texas. Today, it is not only a bedroom community for Austin but also a thriving hub of business, culture, and family life. The city’s story is written in its numbers—population trends, household structures, income, and diversity—all of which paint a picture of a rapidly evolving community.
Round Rock’s population growth reflects broader trends in Central Texas, from rural farming roots to suburban expansion and high-tech development.
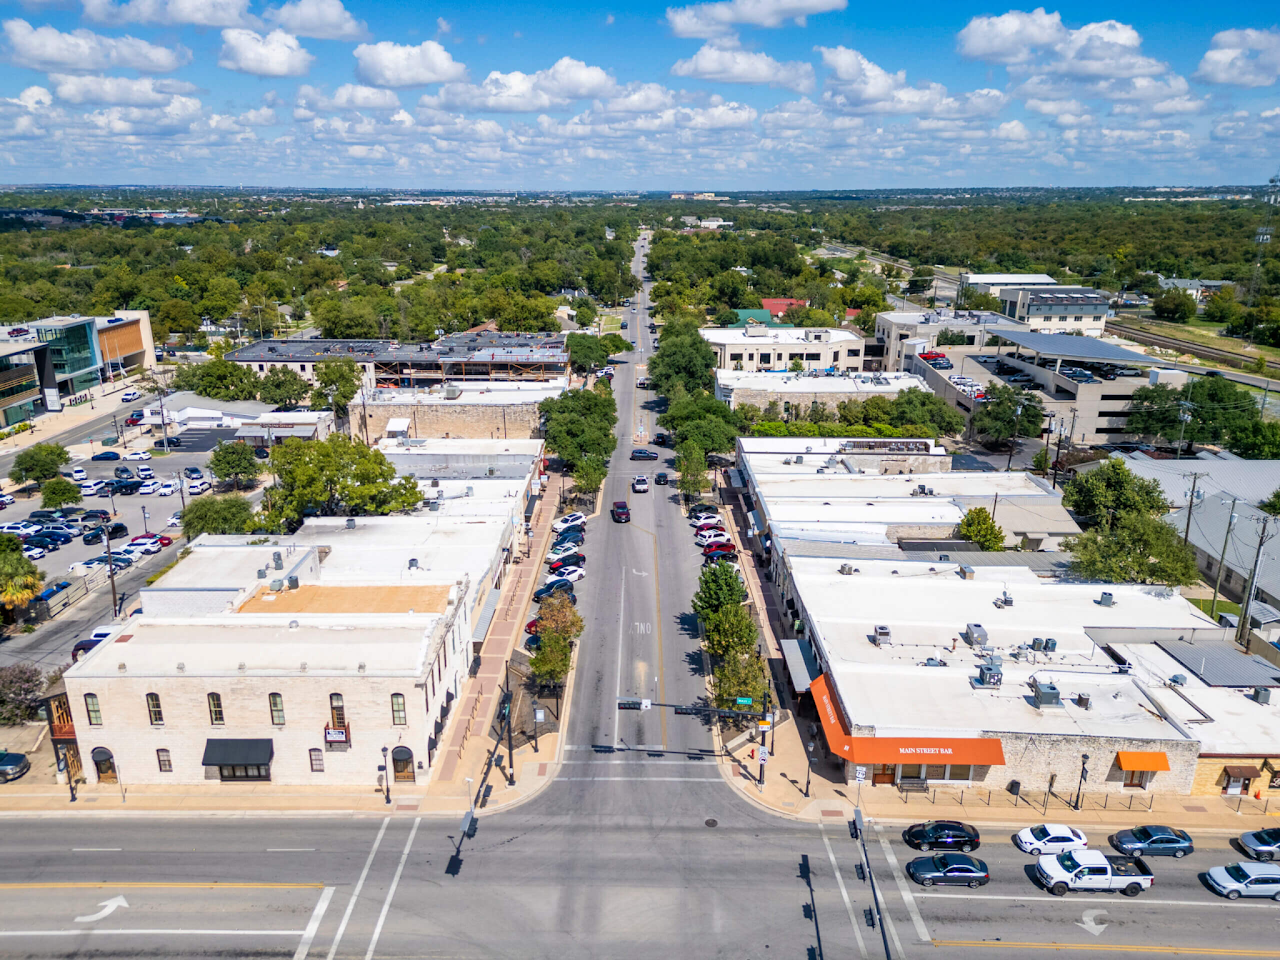
Takeaway: The combination of tech jobs, suburban housing development, and highway access along I-35 made Round Rock one of the fastest-growing mid-sized cities in Texas.
Like much of Central Texas, Round Rock has become significantly more diverse over the past few decades. Between 2000 and 2020, major demographic shifts occurred:
Takeaway: Round Rock is now a truly multicultural city, where residents bring a mix of traditions, cuisines, and languages that enrich community life.
According to the 2020 Census, Round Rock had:
Takeaway: Round Rock is strongly family-oriented, with high owner-occupancy rates and a focus on suburban living. Large households are common, and housing demand continues to push development outward.
Round Rock is a young and growing city, with a strong working-age population and a large number of children.
Takeaway: With nearly one-third of residents under 18 and a median age of just 32, Round Rock is a family-heavy, youthful community—fueling strong demand for schools, parks, and youth services.
Round Rock’s economic profile reflects a blend of high-tech employers, healthcare, education, retail, and professional services.
Takeaway: The city benefits from its dual identity as both a suburban community and an independent job center within the Austin metro.
Education has been a cornerstone of Round Rock’s demographic appeal. The Round Rock Independent School District (RRISD) is highly rated and attracts families from across Texas. Additionally, the presence of Texas State University’s Round Rock campus ensures a steady pipeline of students, professionals, and researchers in fields like healthcare, business, and technology.
Round Rock’s demographics directly influence its cultural vibrancy. A diverse population supports a mix of multilingual programs, international cuisine, and community festivals. The city’s younger age profile means recreational sports, youth programs, and family-friendly amenities are central to community life. At the same time, its increasing diversity fosters inclusivity and cultural exchange, making Round Rock both modern and welcoming.
Round Rock, Texas, is no longer just Austin’s northern neighbor—it is a thriving, diverse, and self-sustaining city in its own right. Its population growth, youthful age structure, family orientation, and increasing cultural diversity make it a magnet for both families and businesses. With continued planning and investment, Round Rock is poised to remain one of the most desirable and dynamic communities in Central Texas.
Key population and demographics indicators compiled from U.S. Census data and the figures you provided. Percent changes are relative to the prior census year unless noted. Hispanic/Latino is treated as an ethnicity and may be of any race.
| Census Year | Population | % Change | Note |
|---|---|---|---|
| 1880 | 628 | — | — |
| 1890 | 1,438 | 129.0% | — |
| 1900 | 1,138 | −20.9% | — |
| 1910 | 1,245 | 9.4% | — |
| 1920 | 900 | −27.7% | — |
| 1930 | 1,005 | 11.7% | — |
| 1940 | 1,173 | 16.7% | — |
| 1950 | 1,683 | 43.5% | — |
| 1960 | 2,458 | 46.0% | — |
| 1970 | 2,811 | 14.4% | — |
| 1980 | 12,740 | 353.2% | — |
| 1990 | 30,923 | 142.7% | — |
| 2000 | 61,136 | 97.7% | — |
| 2010 | 99,887 | 63.4% | — |
| 2020 | 119,468 | 19.6% | — |
| 2022 (est.) | 126,697 | 6.1% | Estimate |
| Race / Ethnicity | 2000 Pop | 2010 Pop | 2020 Pop | 2000 % | 2010 % | 2020 % |
|---|---|---|---|---|---|---|
| White alone (Non-Hispanic) | 40,113 | 53,924 | 56,027 | 65.61% | 53.99% | 46.90% |
| Black or African American (Non-Hispanic) | 4,560 | 9,254 | 11,552 | 7.46% | 9.26% | 9.67% |
| Asian (Non-Hispanic) | 1,727 | 5,056 | 9,668 | 2.82% | 5.06% | 8.09% |
| Hispanic or Latino (any race) | 13,511 | 28,958 | 35,744 | 22.10% | 28.99% | 29.92% |
| Native American/Alaska Native (Non-Hispanic) | 210 | 288 | 312 | 0.34% | 0.29% | 0.26% |
| Pacific Islander (Non-Hispanic) | 5 | 105 | 177 | 0.09% | 0.11% | 0.15% |
| Some Other Race (Non-Hispanic) | 69 | 167 | 714 | 0.11% | 0.17% | 0.60% |
| Multiracial (Non-Hispanic) | 891 | 2,135 | 5,274 | 1.46% | 2.14% | 4.41% |
| Total | 61,136 | 99,887 | 119,468 | 100% | 100% | 100% |
| Indicator | Value |
|---|---|
| Population | 119,468 |
| Households | 41,896 |
| Families | 29,962 |
| Housing Units | 42,580 |
| Owner-Occupied Units | 32,338 (~77% of occupied) |
| Median Home Value | $172,500 |
| Avg. Household Size | 2.87 |
| Avg. Family Size | 3.29 |
| Under 18 | 31.9% |
| 18–24 | 8.5% |
| 25–44 | 38.8% |
| 45–64 | 16.3% |
| 65+ | 4.5% |
| Median Age | 32 |
| Per Capita Income | $30,605 |
| Sex Ratio (males per 100 females) | 98.6 |
Notes: Hispanic/Latino is an ethnicity that may be of any race. 2022 population is an estimate. “More than 130,000” cited by the Texas Demographic Center (date/context not specified).